
Warrior Crunch vs Barebells Protein Bar
Warrior Crunch vs Barebells Protein Bar — the crunch-texture battle, decided by the fat column.
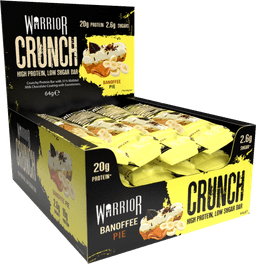
Warrior
Warrior Crunch
31g protein / 100g
Winner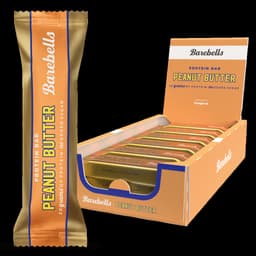
Barebells
Barebells Protein Bar
37g protein / 100g
Representative products shown — the top efficiency scorer in each line. Tap a card for the full product page.
Our verdict
Barebells wins — check the fat
Warrior Crunch markets the crunch; the label tells another story: 19g fat per 100g vs Barebells' 13g, 31g vs 37g protein, and an efficiency score of 67/B against 82/A. That's not a rivalry, it's a weight class difference.
The crunch texture comes at a real macro cost — nearly 50% more fat per 100g. If you're eating bars for protein efficiency, Warrior Crunch is one of the weaker mainstream options we track.
Warrior's defence is taste and texture loyalty. Fair enough — but go in knowing the numbers.
Head to head
Per serving, from UK label data.
| Warrior Crunch | Barebells Protein Bar | |
|---|---|---|
| Protein | 19.8g | 20.4g ✓ |
| Calories | 237 | 198 ✓ |
| Sugar / 100g | 4.0g | 2.6g ✓ |
| Fat / 100g | 19.0g | 13.0g ✓ |
| Clean Score | 84 | 94 ✓ |
Who should buy which
Buy Warrior Crunch if…
The crunch texture is non-negotiable for you and you've tried the alternatives. Treat it as a treat that happens to have protein.
Buy Barebells if…
You want a bar that actually delivers on the protein promise: 37g per 100g, Grade A, 6g less fat per 100g.
Frequently asked
Is Warrior Crunch healthy?
It's a 67/B on our efficiency score with 19g fat per 100g — one of the weaker mainstream bars nutritionally. Fine as an occasional treat, poor as a daily protein source.
Which has more protein?
Barebells: 37g per 100g (20.4g per bar) vs Warrior Crunch's 31g per 100g (19.8g per bar).
Compare them yourself, live
Run Warrior Crunch against Barebells Protein Bar in our interactive compare tool — with your own product picks.
Open in compare tool →More rivalries
Barebells Protein Bar vs Grenade Protein Bar
Grenade by a nose — but buy on flavour — Barebells vs Grenade — the UK's great protein bar debate. Two Grade-A bars separated by almost nothing on the label.
PhD Smart Bar vs Grenade Protein Bar
Grenade wins clearly — PhD Smart Bar vs Grenade Protein Bar — two supermarket staples, but the labels tell very different stories.