
Compare products
Pick any two products and see them head to head — efficiency score, Clean Score and the nutrition numbers that decide them. Every comparison has a shareable link.

We wrote a full verdict on this matchup — with amino-acid data and who-should-buy-which.
Read the verdict →TREK Protein Flapjack Salted Caramel wins 4–2
Decisive on: Efficiency score 34 (D) vs 32 (D); Protein 19 g vs 17 g; Sugar 23 g vs 26.1 g.
Scores reflect label nutrition and verified ingredient lists — not taste. How we score
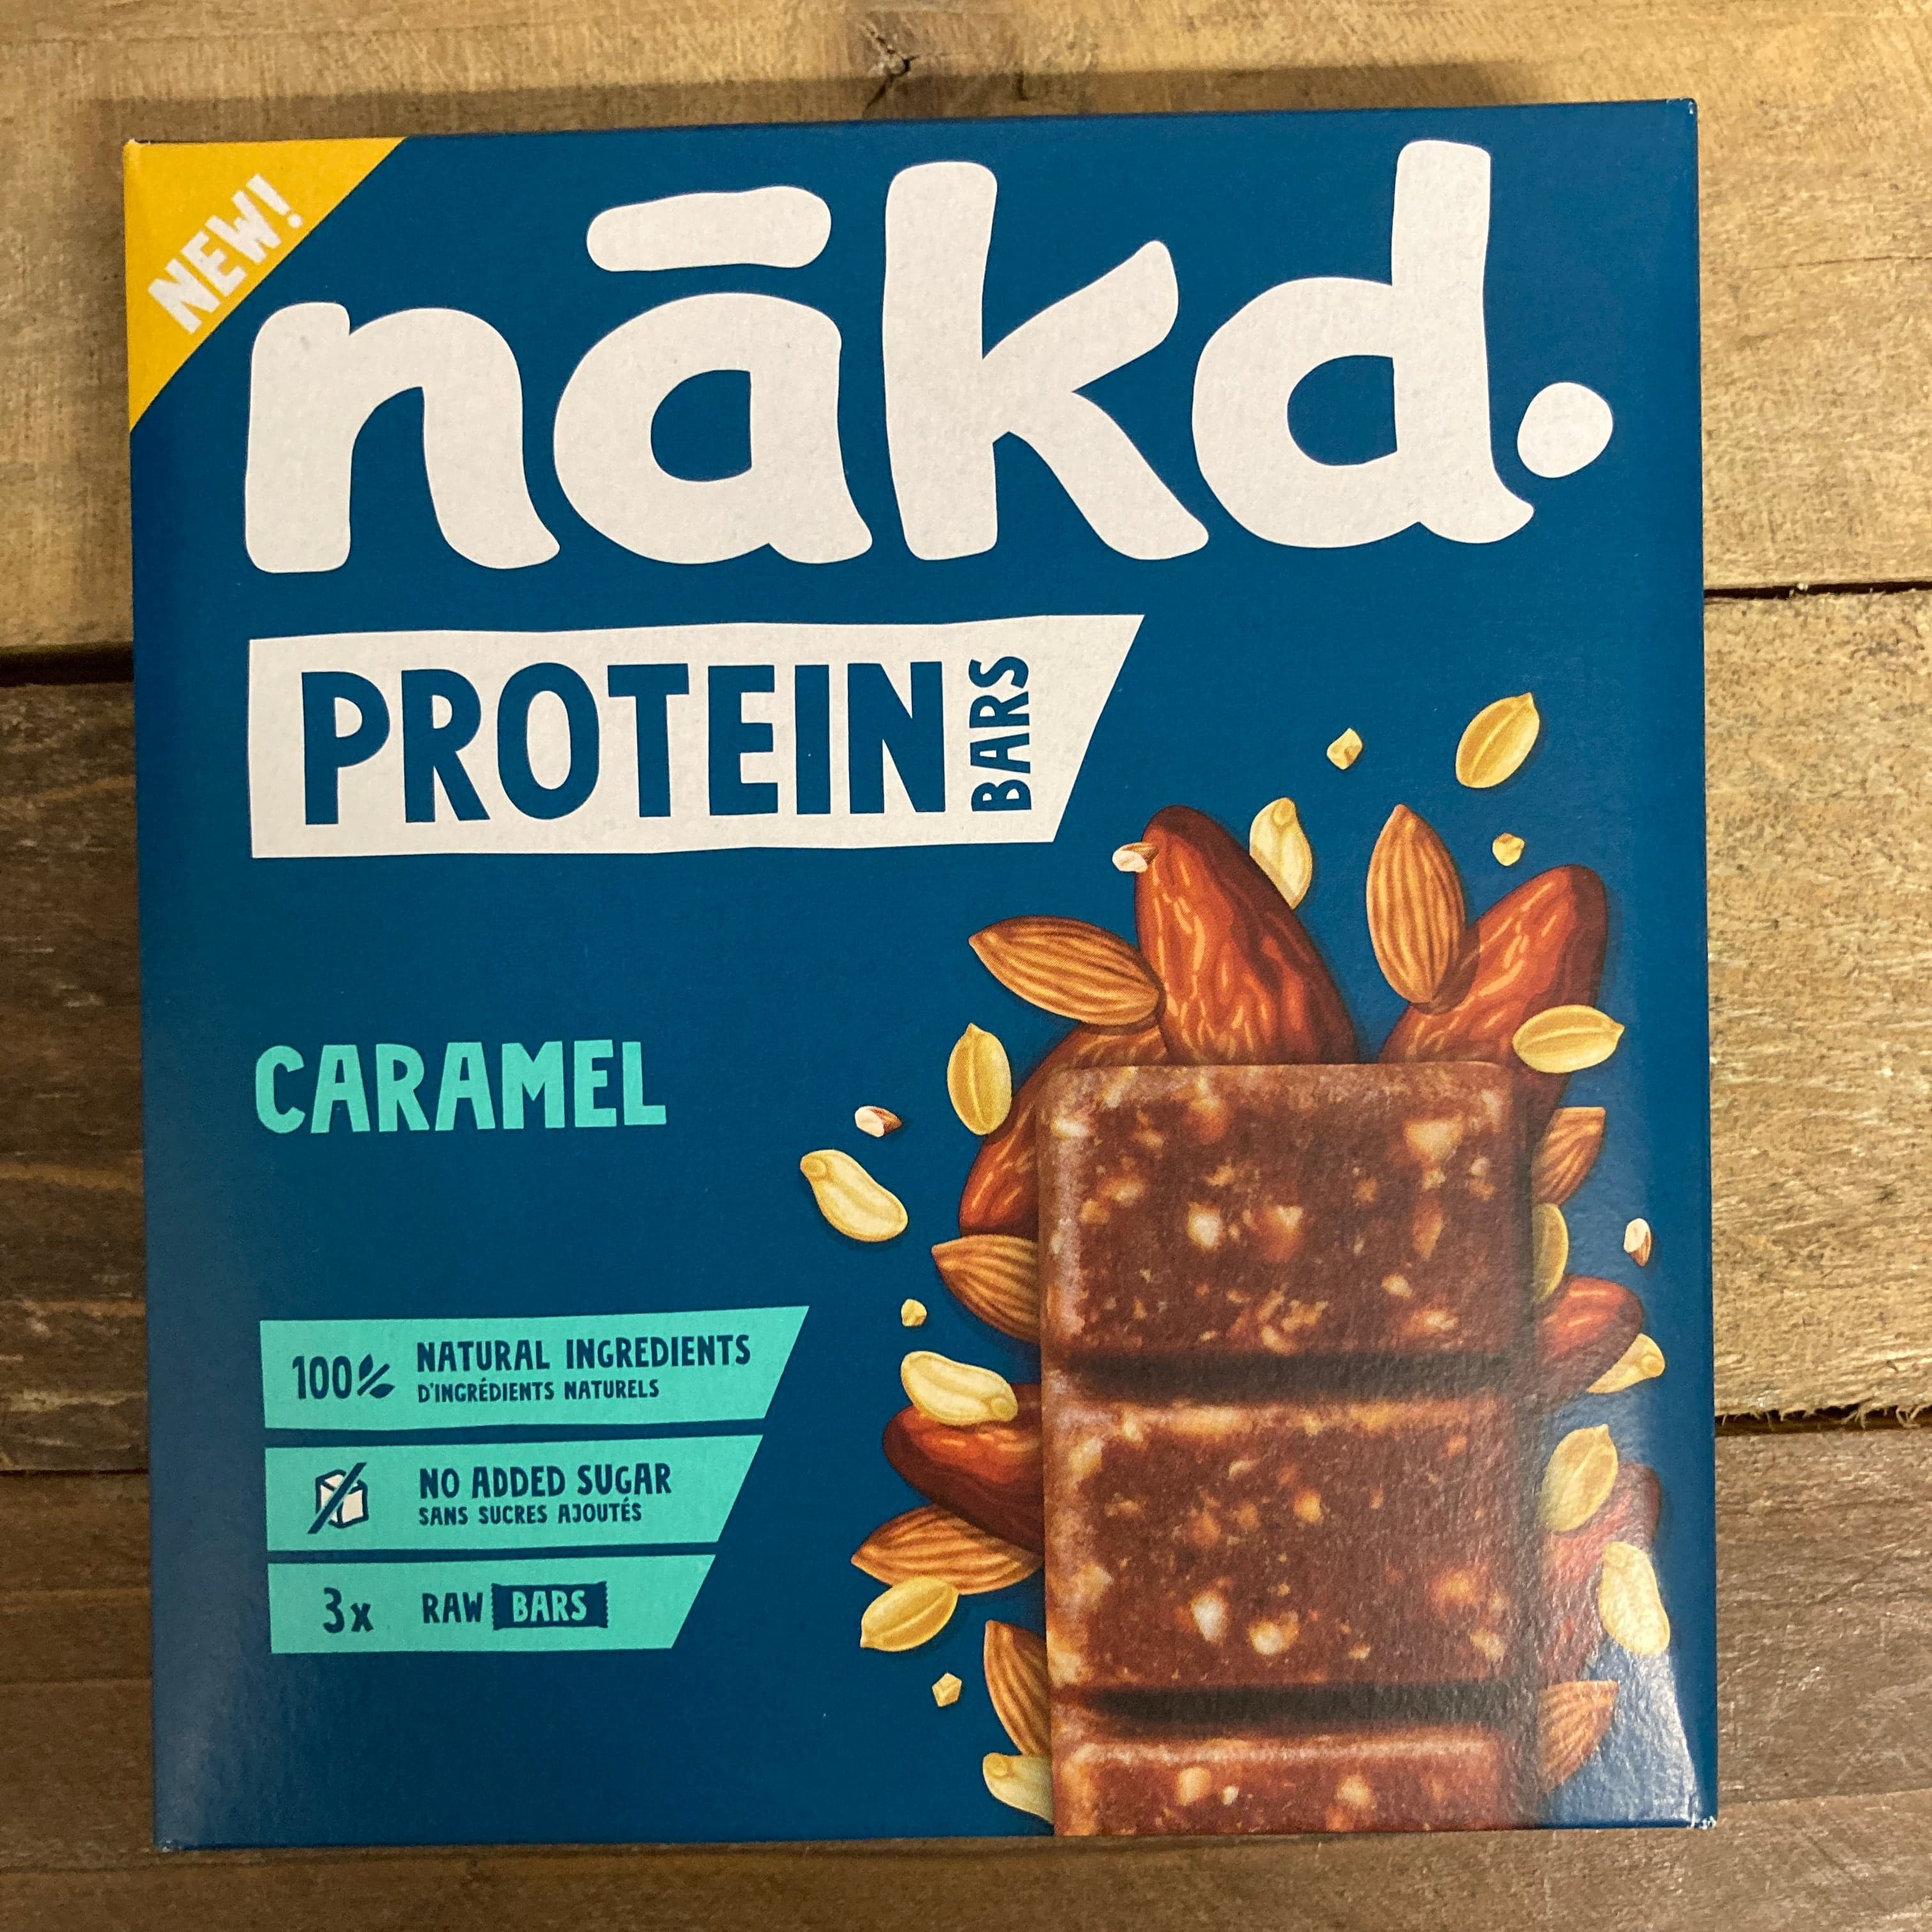
| Metric | TREK Protein Flapjack Salted Caramel | Nakd Protein Bar - Caramel |
|---|---|---|
| Efficiency score | ✓ 34 (D) | 32 (D) |
| Clean Score | 96 · Outstanding | ✓ 100 · Outstanding |
| Protein | ✓ 19 g | 17 g |
| Calories | 447 kcal | ✓ 423 kcal |
| Sugar | ✓ 23 g | 26.1 g |
| Protein % of calories | ✓ 17% | 16% |
| Flavours | 0 | 0 |
| Categories | Protein Bars | Protein Bars |
Share this comparison: proteinscore.co.uk/compare?a=trek-protein-flapjack-salted-caramel&b=nakd-protein-bar-caramel